PowerShell Script to Check Active Directory Member Servers for Automatic Services’ Status

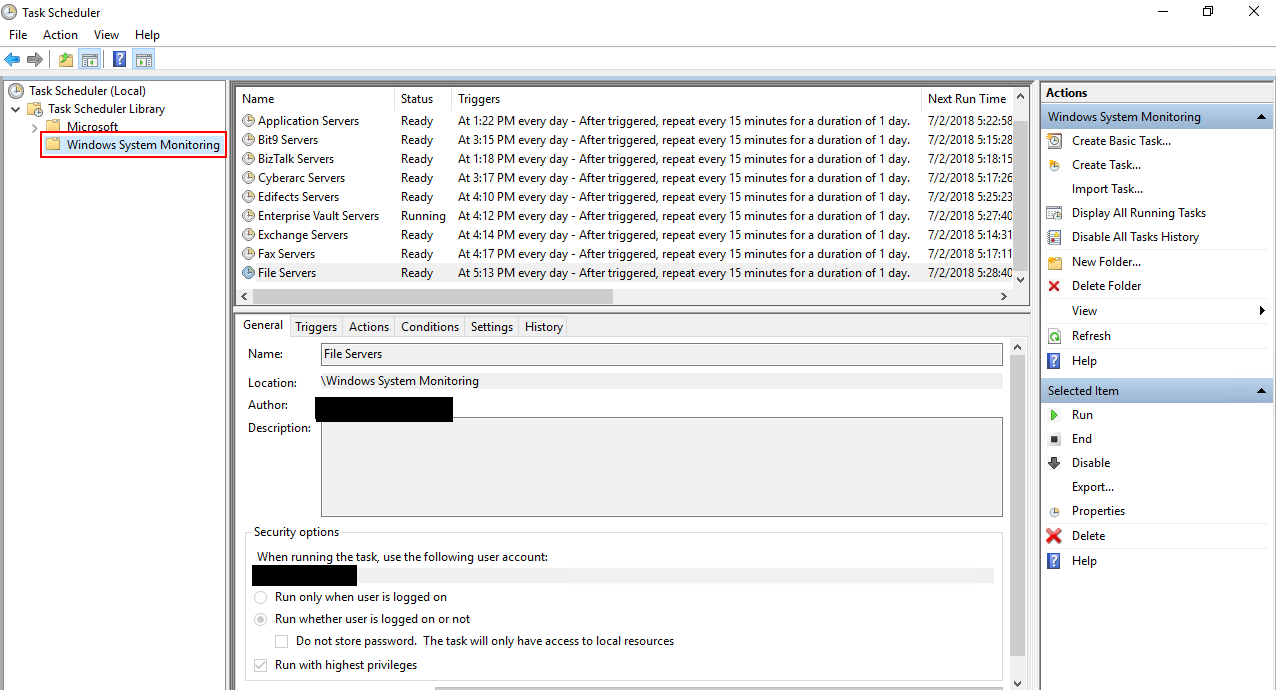
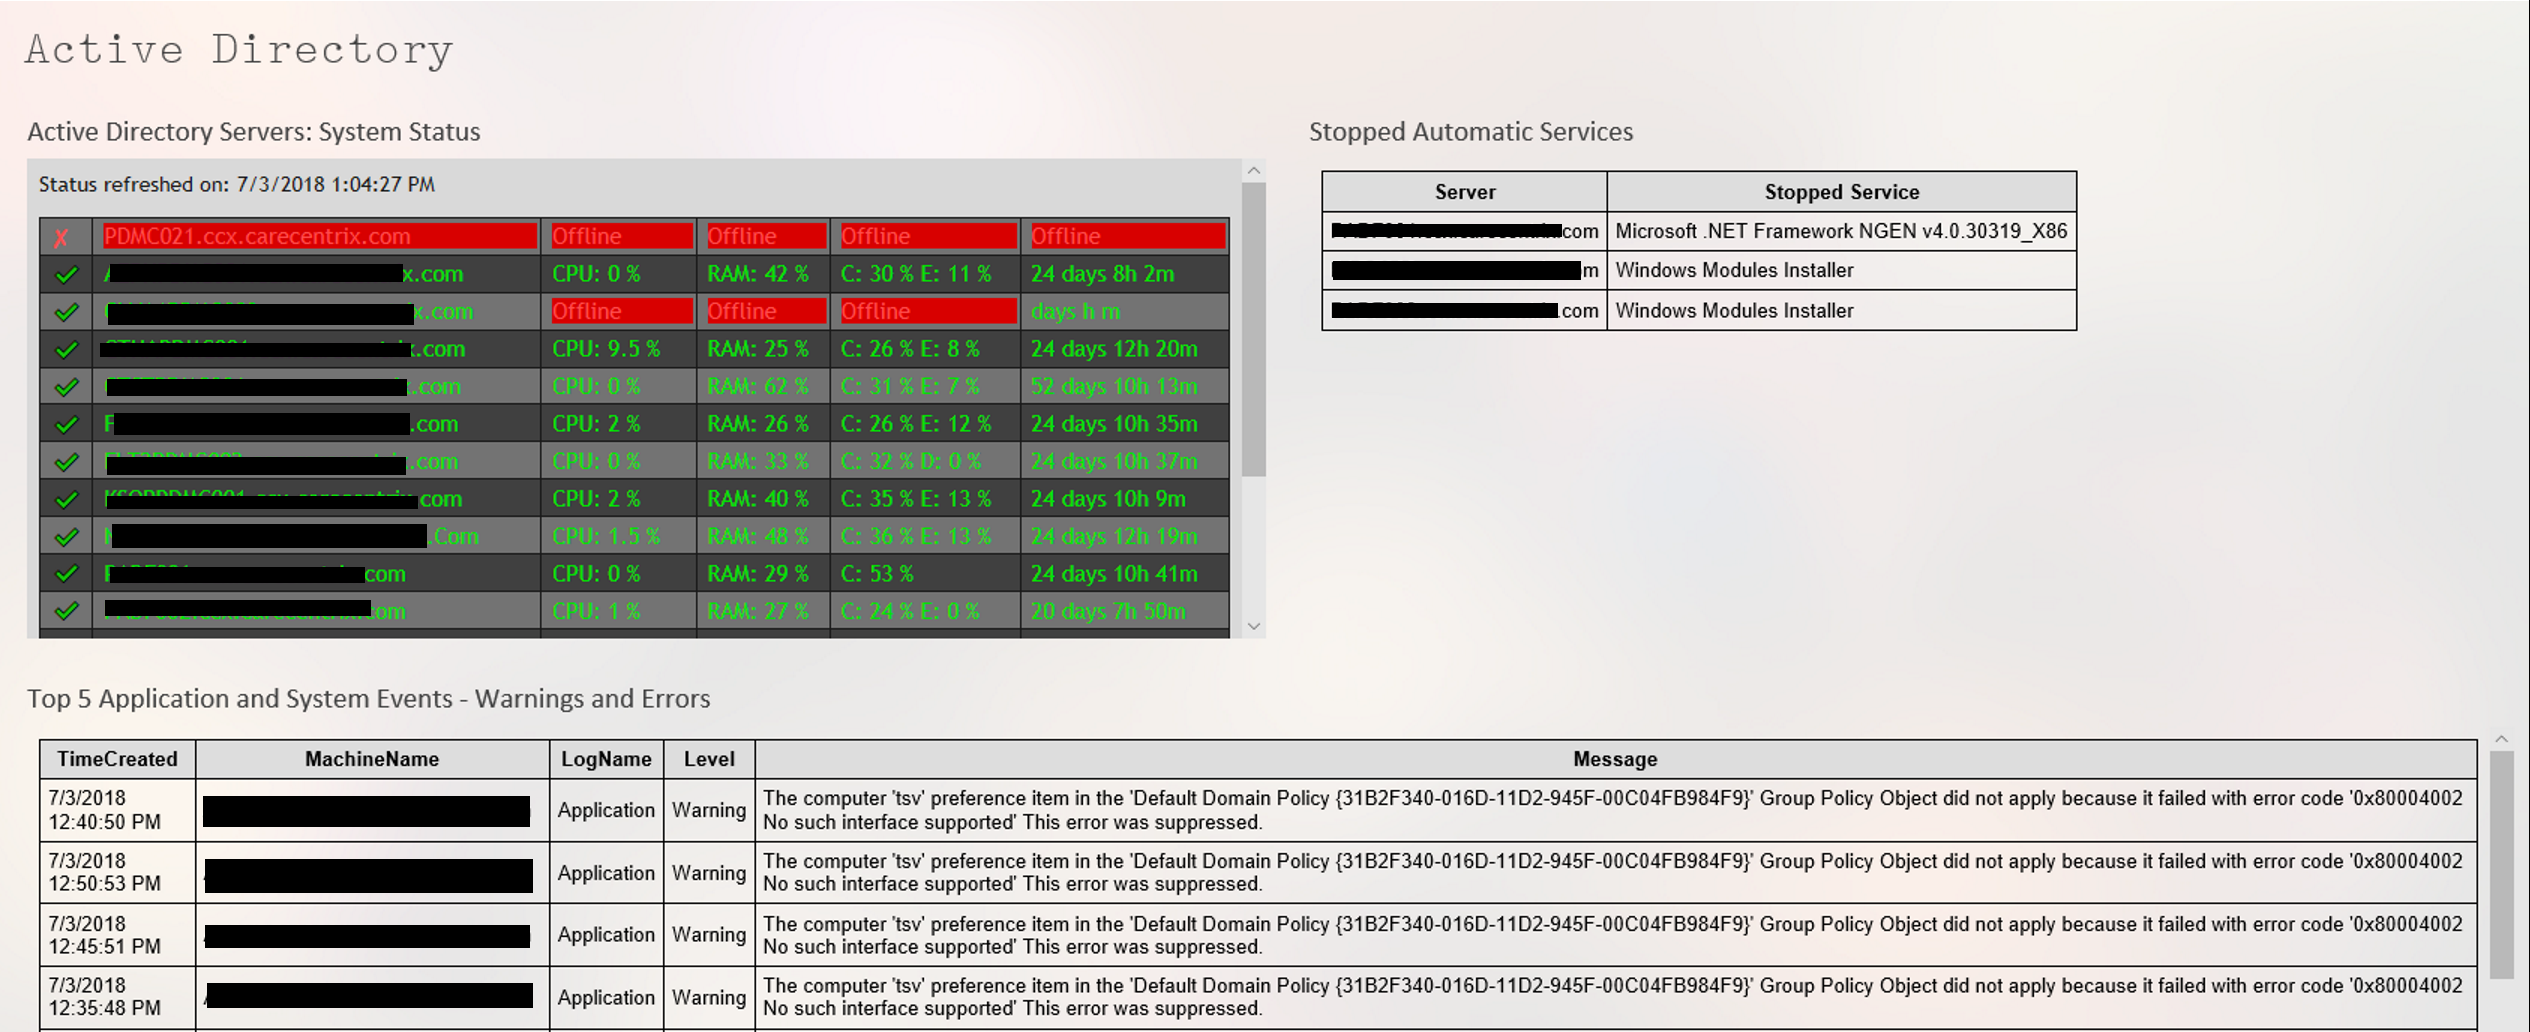
I’ve been caught by an automatic service not starting after system reboots from things like patching. I’ve written several versions of the script below over the years. This is my most recent edition. You’ll need the Active Directory module installed on the system that executes the script.

The code will scan your entire AD for member systems with a Windows Server operating system. It will present you with a list to choose from. It will then test RPC (135) connectivity and scan the automatic services on those that are reachable. The script will report any servers that do not have a status of “running” along with any that were not reachable.

   <#
        .SYNOPSIS
        Checks Acitive Directory Memeber Servers for Automatic Serices that are not currently running.
        .DESCRIPTION
        Dynamically generates list of Active Directory Servers.
        Uses WMI to examine the status of all services set to automatically start on selected servers.
        Filters common automatic services that do not stay started by default: mapsbroker, cdpsvc, gupdate, remoteregistry, sppsvc, wbiosrvc, 
        iphlpsvc, tiledatamodelsvc, clr_optimization, and Microsoft Edge Update are currently excluded from the report.
        .INPUTS
        Get-ServerAutoSerivcesStatus displays a gridview of selectable Active Directory memeber servers. 
        Shift+ and CTRL+ select are enabled.
        CTRL+A to select all.
        Criteria to filter.
        .OUTPUTS
        System.String. / Gridview Get-ServerAutoSerivcesStatus returns a string showing all status on selected servers running, 
        or a gridview of the servers and services that are not. 
        Get-ServerAutoSerivcesStatus also displays a string listing servers that did not respond on TCP 135 (RPC). 
        .EXAMPLE
        PS> Get-ServerAutoSerivcesStatus.ps1
    #>
$ErrorActionPreference = "SilentlyContinue"
$Servers = Get-ADComputer -Filter 'Operatingsystem -Like "*server*"' -Properties dnshostname|
    Select-Object dnshostname -ExpandProperty dnshostname|
    Out-GridView -Title "Select Servers To Enumerate AutoServices. CTRL+A to Select All" -PassThru
$Report = @()
$ErrorLog = @()
$ServersOnline = @()
Write-Host -ForegroundColor Yellow "Please wait, testing connectivity to selected servers....."
Foreach ($Server in $Servers) {
    If ((Test-NetConnection -WarningAction SilentlyContinue -ComputerName $Server -Port 135).tcptestsucceeded){$Serversonline += $Server}
    Else {$Errorlog += $Server}
    }
ForEach ($Server in $ServersOnline) {
    $Wmi = Get-WMIObject win32_service -ComputerName $Server -Filter 'State != "Running" AND StartMode = "Auto"'|
        Select-Object @{n="ServerName"; e={$server}}, @{n="ServiceName";e={$_.name}},@{n="Status";e={$_.state}},@{n="Start Account";e={$_.startname}}
    $Report += $Wmi | Write-Host
    }
$Report | Where-Object {($_.ServiceName -notlike "mapsbroker") -and ($_.ServiceName -notlike "cdpsvc") -and ($_.ServiceName -notlike "gupdate") -and 
    ($_.ServiceName -notlike "remoteregistry") -and ($_.ServiceName -notlike "sppsvc") -and ($_.ServiceName -notlike "wbiosrvc") -and ($_.ServiceName -notlike "iphlpsvc") -and
    ($_.ServiceName -notlike "tiledatamodelsvc") -and ($_.ServiceName -notlike "*clr_optimization*") -and ($_.ServiceName -notlike "Microsoft Edge Update") | 
    Select-Object @{n="Server";e={$server}}, @{n="Stopped Service";e={$_.displayname}
        }
    }
If ($Rerport -ne $null) {$Report | Out-GridView -Title "These automatic serivces are not running"}
    Else {Write-Host -ForegroundColor Green "All Automatic Services on $($Serversonline.count) reachable servers are started."}
If ($ErrorLog -ne $null) {Write-Host -ForegroundColor Red "These $($ErrorLog.count) servers were not reachable via RPC (port 135)`n `n" ($ErrorLog -join ",`n")}
    Else {Write-Host "No connection issues to selected servers detected."}
Pause
Exit

Enterprise IT Monitoring, Alerting, and Dashboarding with Solarwind’s Orion

A while back, I wrote a series of articles on using PowerShell to create a decent monitoring system . It’s nothing fancy, but it gets the job done and costs nothing but time and effort to implement. If your needs continue to grow you’ll be left with two choices: continue to pound out code to expand functionality, or purchase a commercial solution.

Once you’ve reached the time wall and have decided to invest in a commercial monitoring application, the question becomes, which one should you get? In my career as a consultant and IT employee, I’ve setup and worked with countless monitoring solutions, Altiris, Nagios, System Center, BladeLogic, GFI, Spiceworks, Appdynamics, and Cacti just to name a few. One option that never lets me down is Solarwind’s Orion platform.

Solarwinds has been a player in IT for quite some time. Their Network Performance Monitor frequently makes the “best of” lists. I’ve run into their Web Help Desk ticketing and change management application at multiple companies including my current employer. They may be best known in computer worker circles for their free IT tools like Network Device Monitor and Kiwi Syslog Server. Not everyone is aware that they also make a full enterprise monitoring platform.

Monitoring Funnel

Orion is a platform in the true sense of the word. Modules that you choose plug in to Orion to add functionality. For example, the Network Performance Monitor collects netflow and SNMP data from your switches and routers and adds that information to your Orion databases. The Server Application Monitor uses SNMP, WMI, or an agent to collect data from almost all operating systems and countless applications. Modules also typically include dashboard widgets, reports, alerts, and other useful items that allow you to better utilize the collected data.

I use NPM and SAM at my current employer everyday to monitor and manage our sprawling network. Network equipment, Windows severs, Linux servers, countless SQL databases, Exchange, AD, and even their AS\400 servers are all covered by the platform. Much like golf, it takes a few hours to get the basics (install / discover) and a lifetime to master. The amount of customization Orion offers can be overwhelming but once you get your feet wet, you can accomplish some truly impressive feats. Watch for more articles on Solarwinds Orion in the near future. We’ll be talking about creating custom dashboards, alerts, reports, and more.

Orion-VMware

PowerShell Monitoring Part 5. Putting it all together. HTML and scheduled tasks.

In part one of this series, we wrote a script that would get errors and warnings for the last hour for a list of servers and output the results to an HTML file in a simple table. In part two, we capture all services for a list of servers that are set to automatic but not currently running, and output that list to an HTML table. Part 3 describes how to use the Windows Server Status Monitor script available at GitHub and the PowerShellGallery to monitor Online status, CPU Load, Memory Load, and Disk Space.  Part 4  dynamically generates the lists of servers that the first three scripts will need to run.

To make the monitoring system work, there are still a few things we need to do. First, we need to set up a server with IIS or some other web hosting engine. To be honest, I like SharePoint, the newest version isn’t available in a free edition, but if you have an Office 365 subscription it is included. If not, the last free version you can get is SharePoint 2013 Foundation. Speaking of SharePoint, you could add some additional code to the scripts to upload the results of our scans straight into a SharePoint library, but this isn’t as easy as it sounds. I prefer to add another IIS site to the SharePoint server and then proceed with the architecture out-lined below. After you’re done, you’ll use SharePoint’s content viewer web part to build cohesive system report pages which I’ll get into further on in this post.

I’m not going to go through all the steps needed to get a web server up and running here. You can search for the instructions easily enough and including them would make this article a book. In any modern version of Windows server, you add the web server role. If you’re going with SharePoint, when you run the installer it will guide you through the pre-requisites.

Once you have IIS up and running you need to add virtual directories for each group of servers that you want to monitor. Before you can add the VR directories you need to create the actual folders on whichever drive you want to store all of this data on. Make a folder for each environment that you’re going to monitor for example: development and production. Then, under each of those, create a folder for each group of servers: AD, Exchange, SQL, that you built lists for.

The virtual directory alias is the path you will use to access the html files placed into the matching folders by the scripts. You’ll type http://www.webservername.com/vr_directory_alias/name_of_file.html to access the reports for each group of servers. To make a new virtual directory in IIS, right-click on the site that you are using and pick new virtual directory from the drop down menu. Then fill out the pop-up form.

Once you’ve gotten your directory structure and web host all squared away, it’s time to start scanning servers and creating the files that get dumped into the folders you’ve just made. If you followed the instructions in the preceding articles, there should be three scripts in the C:\Program Files\WindowsPowerShell\Scripts folder. We put them in this particular folder to make calling them with additional scripts easier.

We’re going to make another series of scripts that call our scanning tools with the lists we’ve made as input parameters and the folders we’ve made as output paths. Then, we’ll schedule our calling scripts as automated tasks that run every few minutes and wallah, a full system monitoring tool is born.

I like to add a timer and an alert email to my scanning task script so that I know how long each group takes to complete. You will need to change the paths, SMTP server and email addesses in the script below to match your environment. You will make one of these scripts for each group of servers you want to montior (match the folders you made above). Store them all somewhere that makes sense to you, placing them in the VR directory folders will work fine.


$ErrorActionPreference = "SilentlyContinue"

$adtimer = [Diagnostics.Stopwatch]::StartNew()

WinServ-Status.ps1 -List E:\Prod\ad_servers.txt -O E:\ServerStatus\Prod\AD\ -DiskAlert 80 -CpuAlert 95 -MemAlert 85 -Light

Get-StoppedServices.ps1 -list E:\Prod\ad_servers.txt -outputpath E:\ServerStatus\Prod\AD\stoppedservices.html

Get-ServerEvents.ps1 -list E:\Prod\ad_servers.txt -outputpath E:\ServerStatus\Prod\AD\errorevents.html

$adtimer.stop()

$time = $adtimer.Elapsed

Send-MailMessage -SmtpServer smtp.mymailserver.com -From ServerStatus@mydomain.com -To me@my.com -Subject "AD Status Elapsed Time" -Body "All prodcution Active Directory servers processed in $time (Hours, Minutes, Seconds) HTML pages updated."

Once you’ve finsihed creating the scanning task scripts, we’ll need to schedule them as repeating tasks using the Windows task scheduler. Be sure the account that you choose to excute these scripts with has enough permssions to scan the servers and that WinRM is enabled on the systems you are collecting data from.

Scheduled_Task_Folder
Add a folder for all the tasks

Task_trigger
This task runs every 15 minutes, note the Daily and Repeat options.

task_action
Powershell.exe goes in the program or script box. Enter the full path to your script between “” in the arguments.

When you save the task you’ll be prompted for the credentials to run it with. Running the scripts does consume resources from the server(s). Tune your schedule to be frequent enough to be useful, but not too taxing on the servers. Every 15 minutes works well in my environment.

Assuming you’ve followed all the articles in this series and that your scheduled tasks have executed at least once you should now be able to access the pages for each group of systems. In your browser you’ll go to: http://nameofserver/virtualdirectory/errorevents.html
http://nameofserver/virtualdirectory/stoppedservices.html
http://nameofserver/virtualdirectory/winservstatus.html
The system is functional but not very convienient. It would be better to see each group on their own page; all AD status, or all Exchange status for example. There are several ways you could accomplish this.

If you have SharePoint, build a site for ServerStatus. Add a page for each group of servers (AD, Exchange, etc.) and on each page insert three content viewer web parts. Each content viewer web part will reference the output html page of one of the status scripts. Take your time and be sure to title the web parts appropriately. If you’re careful, you can end up with something that looks like a professional monitoring tool. SharePoint’s menu system will build the drop down menus that you see in the title image automatically.

Iframed_Pages

If you don’t have SharePoint you can get a simliar effect by using iframes. You’ll need to create a master html page for each group. AD.HTML for example, then use an iframe to embed the output of each of the three scripts onto the page. The HTML to create an iframe is:


With a lot of work and time you can build a tool that keeps watch over your servers while you work on other things. There’s no limit to how far you can take a tool like this. Alerts for thresholds, reports, and more are just a few lines of code away.

PowerShell; System Monitoring Part 1. Get-ServerEvents, a windows event log error report.

After you have more than a handful of servers on your network, it can be challenging to catch small issues before they take something down and get noticed by users. What you need is a good monitoring tool; one that captures resource consumption, error events, installed software, shows patching status, and that generally helps you keep an eye on your systems.

If your place is like a lot of the businesses I’ve worked for, you probably have a bunch of emailed reports from various systems that amount to SPAM. You try to watch the emails and texts but they vomit so much useless data all over your inbox that its hard to make sence of it. Important notifications end up lost in the noise.

Purchasing a multi-thousand dollar monitoring tool is not always possible. The more nodes you have, the more expensive a monitoring tool will be. Math says that you won’t need a monitoring tool until you have a lot of stuff to watch, which almost guarantees that a commercial solution it isn’t going to be cheap. Spending money on something that doesn’t directly generate profitable returns can be a challenge for any company but outages hurt customer and worker confidence in your systems. This situation can leave technologists feeling trapped.

As system admins, engineers, or architects, we know that the operating system has and reports most, if not all, of the information that we require. We can connect the MMC Computer Management snap-in or the Server Administrator tool to almost any computer and see its event logs, service status, and more. The problem is, that the data isn’t correlated and filtered in a way that provides us with the up/down, big picture, view that we need to proactively correct small problems before they become big ones.

Computermanagement

In this series we’ll examine how PowerShell can help gather all of the data we need from every windows system attached to our network. We’ll use it to generate HTML reports that, in the end, will be uploaded to a web hosting engine so that we can see our system’s status at a glance. The solution isn’t going to compete with System Center or Solarwinds but its better than 10,000 unread items in your inbox and it is entirely free (assuming that you have Windows CALS).

I have to break this down into component parts, or the post would be a book. Stick with me and I think that you’ll end up with a functioning monitoring tool. Feel free to take all the credit for yourself. Maybe your boss will give you a raise. Just read my blog once in a while without your ad-blocker turned on and we’ll be even.

First up is the Windows event logs. Microsoft, in all of their geniousnous; has been spitting out the classic Application, Security, Setup, and System event logs for as long as I can remember. The amount of data they collect is impressive. Typically, they are my first stop on any trouble shooting endeavor. We all know the drill; open the Computer Management MMC, right-click on the system name to connect to a remote PC, and then filter for errors and warnings. You can configure them to dump to a database for correlation / indexing but most of us never get that far. We end up logging on to a problem system and manually checking the logs for relevant messages one at time. Stop doing that, you’ll go blind!

PowerShell will get us the same information, a nice filtered for errors, view of the logs but it can do it in bulk.. The code below is written to be a module that you can call from a scheduled task or from another script. If you’re going to follow the whole series to build my tool you will want to run it as a module. Copy the code and save it as a Get-ServerEvents.ps1 file in the C:\Program Files\WindowsPowerShell\Scripts folder. If the scripts folder isn’t there; make it.

Poweshell Modules

param (
[string] $list,
[string] $outputpath
)
$style = "
BODY{font-family: Arial; font-size: 10pt;}"
$style = $style + "TABLE{border: 1px solid black; border-collapse: collapse;}"
$style = $style + "TH{border: 1px solid black; background: #dddddd; padding: 5px; }"
$style = $style + "TD{border: 1px solid black; padding: 5px; }"
$style = $style + ""

Function Get-Events {
$servers = Get-Content $list
Foreach ($server in $servers) {
Get-WinEvent -ComputerName $server -MaxEvents 5 -FilterHashtable @{Logname ="Application"; Level=2,3;StartTime=(get-date).AddHours(-1)},
@{Logname ="System"; Level=2,3;StartTime=(get-date).AddHours(-1)} -ErrorAction SilentlyContinue|Select TimeCreated, MachineName, Logname,@{n="Level";e={$_.LevelDisplayName}},Message
}
}
$report = Get-Events|Sort-Object Machinename, Logname |ConvertTo-Html -head $style|Out-String
$report|out-file -FilePath $outputpath

The script will gather the last 5 application and system event log errors and warnings that occurred in the last hour for a list of servers and output them into a basic HTML table.

To run the script, create a *.txt or *.csv file containing the hostnames of the systems you want to see events for and then call or run it with the -list and -outputpath parameters. For example; Get-ServerEvents.ps1 -list c:\users\myname\my documents\ad_serverts.txt -outputpath \\reports_server\myreports\ad_serverts.html

If you don’t want to mess with text files you could also use the OU structure in AD as the source of your computer names. Mine organizational units didn’t line up with the way I needed my reports to look hence the text file parameter. If you don’t have that problem try changing the $server variable.

$servers = Get-ADComputer -Filter * -Searchbase “OU=MyOU, DC=mydomain, DC=com | Select dnshostname -ExpandProperty dnshostname
[/Code]

When you run the report you’ll end up with a nice, neat, HTML file like the one below. It’s easy to attach to an email notification; just add a Send-Mailmessage command to the bottom of the script. If you follow the rest of this series we’ll end up publishing the report(s) to a website.

Event report