
In part one of this series, we wrote a script that would get errors and warnings for the last hour for a list of servers and output the results to an HTML file in a simple table. In part two, we capture all services for a list of servers that are set to automatic but not currently running, and output that list to an HTML table. Part 3 describes how to use the Windows Server Status Monitor script available at GitHub and the PowerShellGallery to monitor Online status, CPU Load, Memory Load, and Disk Space. Part 4 dynamically generates the lists of servers that the first three scripts will need to run.
To make the monitoring system work, there are still a few things we need to do. First, we need to set up a server with IIS or some other web hosting engine. To be honest, I like SharePoint, the newest version isn’t available in a free edition, but if you have an Office 365 subscription it is included. If not, the last free version you can get is SharePoint 2013 Foundation. Speaking of SharePoint, you could add some additional code to the scripts to upload the results of our scans straight into a SharePoint library, but this isn’t as easy as it sounds. I prefer to add another IIS site to the SharePoint server and then proceed with the architecture out-lined below. After you’re done, you’ll use SharePoint’s content viewer web part to build cohesive system report pages which I’ll get into further on in this post.
I’m not going to go through all the steps needed to get a web server up and running here. You can search for the instructions easily enough and including them would make this article a book. In any modern version of Windows server, you add the web server role. If you’re going with SharePoint, when you run the installer it will guide you through the pre-requisites.
Once you have IIS up and running you need to add virtual directories for each group of servers that you want to monitor. Before you can add the VR directories you need to create the actual folders on whichever drive you want to store all of this data on. Make a folder for each environment that you’re going to monitor for example: development and production. Then, under each of those, create a folder for each group of servers: AD, Exchange, SQL, that you built lists for.


The virtual directory alias is the path you will use to access the html files placed into the matching folders by the scripts. You’ll type http://www.webservername.com/vr_directory_alias/name_of_file.html to access the reports for each group of servers. To make a new virtual directory in IIS, right-click on the site that you are using and pick new virtual directory from the drop down menu. Then fill out the pop-up form.


Once you’ve gotten your directory structure and web host all squared away, it’s time to start scanning servers and creating the files that get dumped into the folders you’ve just made. If you followed the instructions in the preceding articles, there should be three scripts in the C:\Program Files\WindowsPowerShell\Scripts folder. We put them in this particular folder to make calling them with additional scripts easier.
We’re going to make another series of scripts that call our scanning tools with the lists we’ve made as input parameters and the folders we’ve made as output paths. Then, we’ll schedule our calling scripts as automated tasks that run every few minutes and wallah, a full system monitoring tool is born.
I like to add a timer and an alert email to my scanning task script so that I know how long each group takes to complete. You will need to change the paths, SMTP server and email addesses in the script below to match your environment. You will make one of these scripts for each group of servers you want to montior (match the folders you made above). Store them all somewhere that makes sense to you, placing them in the VR directory folders will work fine.
$ErrorActionPreference = "SilentlyContinue"

$adtimer = [Diagnostics.Stopwatch]::StartNew()

WinServ-Status.ps1 -List E:\Prod\ad_servers.txt -O E:\ServerStatus\Prod\AD\ -DiskAlert 80 -CpuAlert 95 -MemAlert 85 -Light

Get-StoppedServices.ps1 -list E:\Prod\ad_servers.txt -outputpath E:\ServerStatus\Prod\AD\stoppedservices.html

Get-ServerEvents.ps1 -list E:\Prod\ad_servers.txt -outputpath E:\ServerStatus\Prod\AD\errorevents.html

$adtimer.stop()

$time = $adtimer.Elapsed

Send-MailMessage -SmtpServer smtp.mymailserver.com -From ServerStatus@mydomain.com -To me@my.com -Subject "AD Status Elapsed Time" -Body "All prodcution Active Directory servers processed in $time (Hours, Minutes, Seconds) HTML pages updated."
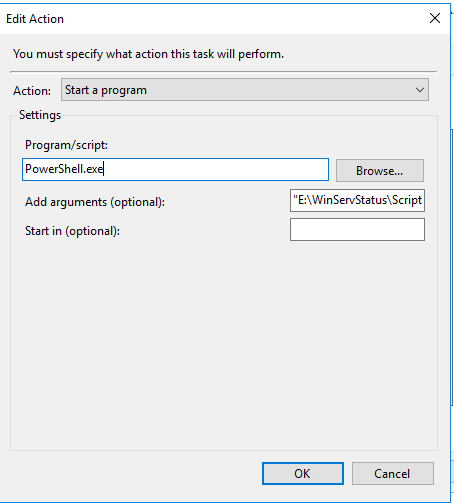
Once you’ve finsihed creating the scanning task scripts, we’ll need to schedule them as repeating tasks using the Windows task scheduler. Be sure the account that you choose to excute these scripts with has enough permssions to scan the servers and that WinRM is enabled on the systems you are collecting data from.
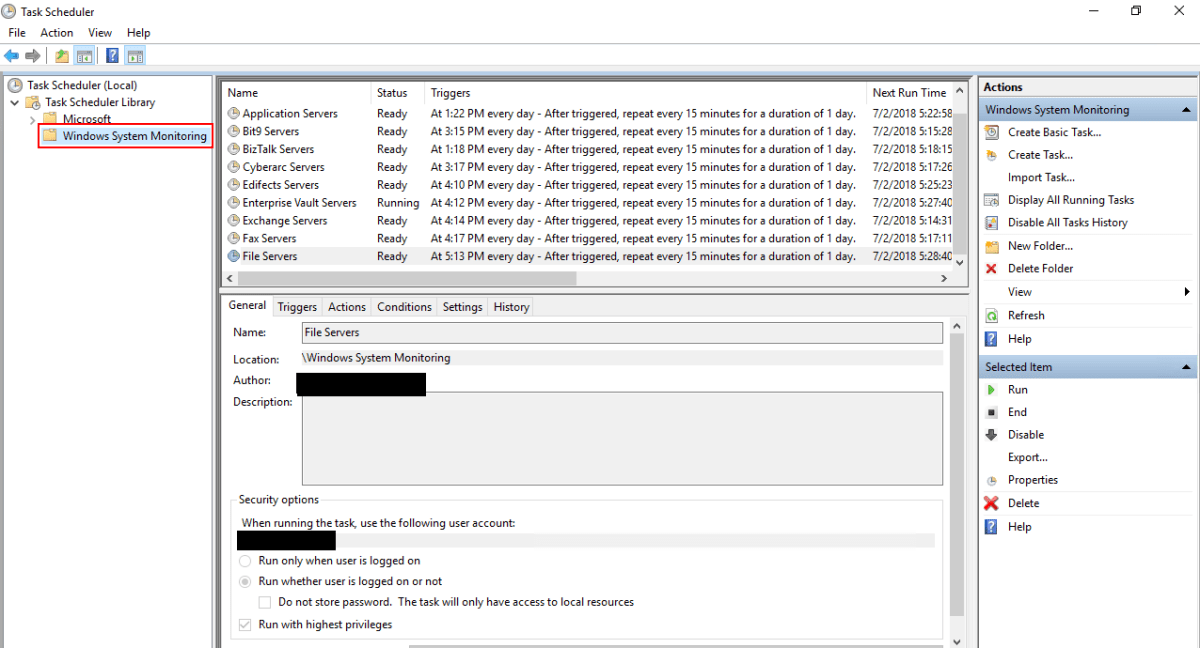

When you save the task you’ll be prompted for the credentials to run it with. Running the scripts does consume resources from the server(s). Tune your schedule to be frequent enough to be useful, but not too taxing on the servers. Every 15 minutes works well in my environment.
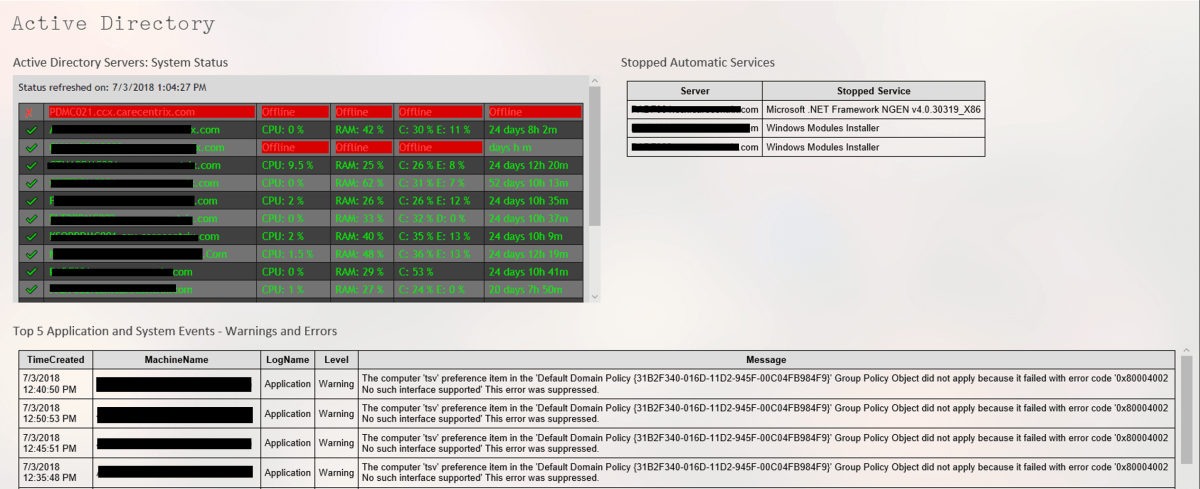
Assuming you’ve followed all the articles in this series and that your scheduled tasks have executed at least once you should now be able to access the pages for each group of systems. In your browser you’ll go to: http://nameofserver/virtualdirectory/errorevents.html
http://nameofserver/virtualdirectory/stoppedservices.html
http://nameofserver/virtualdirectory/winservstatus.html
The system is functional but not very convienient. It would be better to see each group on their own page; all AD status, or all Exchange status for example. There are several ways you could accomplish this.
If you have SharePoint, build a site for ServerStatus. Add a page for each group of servers (AD, Exchange, etc.) and on each page insert three content viewer web parts. Each content viewer web part will reference the output html page of one of the status scripts. Take your time and be sure to title the web parts appropriately. If you’re careful, you can end up with something that looks like a professional monitoring tool. SharePoint’s menu system will build the drop down menus that you see in the title image automatically.
If you don’t have SharePoint you can get a simliar effect by using iframes. You’ll need to create a master html page for each group. AD.HTML for example, then use an iframe to embed the output of each of the three scripts onto the page. The HTML to create an iframe is:
With a lot of work and time you can build a tool that keeps watch over your servers while you work on other things. There’s no limit to how far you can take a tool like this. Alerts for thresholds, reports, and more are just a few lines of code away.

hmm, the code is missing, ‘The HTML to create an iframe is:’ [blank].. it’s even that way on the Wayback Machine
LikeLike
WordPress won’t display the iframe. Even if I put it in a code block.
I<iframe width="100%" height="745" src="https://www.rainviewer.com/map.html?loc=38.44498466889473,-96.94335937500001,5&oFa=0&oC=1&oU=1&oCUB=1&oCS=1&oF=1&oAP=1&rmt=1" frameborder="0"
LikeLike