PowerShell Monitoring Part 5. Putting it all together. HTML and scheduled tasks.

In part one of this series, we wrote a script that would get errors and warnings for the last hour for a list of servers and output the results to an HTML file in a simple table. In part two, we capture all services for a list of servers that are set to automatic but not currently running, and output that list to an HTML table. Part 3 describes how to use the Windows Server Status Monitor script available at GitHub and the PowerShellGallery to monitor Online status, CPU Load, Memory Load, and Disk Space.  Part 4  dynamically generates the lists of servers that the first three scripts will need to run.

To make the monitoring system work, there are still a few things we need to do. First, we need to set up a server with IIS or some other web hosting engine. To be honest, I like SharePoint, the newest version isn’t available in a free edition, but if you have an Office 365 subscription it is included. If not, the last free version you can get is SharePoint 2013 Foundation. Speaking of SharePoint, you could add some additional code to the scripts to upload the results of our scans straight into a SharePoint library, but this isn’t as easy as it sounds. I prefer to add another IIS site to the SharePoint server and then proceed with the architecture out-lined below. After you’re done, you’ll use SharePoint’s content viewer web part to build cohesive system report pages which I’ll get into further on in this post.

I’m not going to go through all the steps needed to get a web server up and running here. You can search for the instructions easily enough and including them would make this article a book. In any modern version of Windows server, you add the web server role. If you’re going with SharePoint, when you run the installer it will guide you through the pre-requisites.

Once you have IIS up and running you need to add virtual directories for each group of servers that you want to monitor. Before you can add the VR directories you need to create the actual folders on whichever drive you want to store all of this data on. Make a folder for each environment that you’re going to monitor for example: development and production. Then, under each of those, create a folder for each group of servers: AD, Exchange, SQL, that you built lists for.

The virtual directory alias is the path you will use to access the html files placed into the matching folders by the scripts. You’ll type http://www.webservername.com/vr_directory_alias/name_of_file.html to access the reports for each group of servers. To make a new virtual directory in IIS, right-click on the site that you are using and pick new virtual directory from the drop down menu. Then fill out the pop-up form.

Once you’ve gotten your directory structure and web host all squared away, it’s time to start scanning servers and creating the files that get dumped into the folders you’ve just made. If you followed the instructions in the preceding articles, there should be three scripts in the C:\Program Files\WindowsPowerShell\Scripts folder. We put them in this particular folder to make calling them with additional scripts easier.

We’re going to make another series of scripts that call our scanning tools with the lists we’ve made as input parameters and the folders we’ve made as output paths. Then, we’ll schedule our calling scripts as automated tasks that run every few minutes and wallah, a full system monitoring tool is born.

I like to add a timer and an alert email to my scanning task script so that I know how long each group takes to complete. You will need to change the paths, SMTP server and email addesses in the script below to match your environment. You will make one of these scripts for each group of servers you want to montior (match the folders you made above). Store them all somewhere that makes sense to you, placing them in the VR directory folders will work fine.


$ErrorActionPreference = "SilentlyContinue"

$adtimer = [Diagnostics.Stopwatch]::StartNew()

WinServ-Status.ps1 -List E:\Prod\ad_servers.txt -O E:\ServerStatus\Prod\AD\ -DiskAlert 80 -CpuAlert 95 -MemAlert 85 -Light

Get-StoppedServices.ps1 -list E:\Prod\ad_servers.txt -outputpath E:\ServerStatus\Prod\AD\stoppedservices.html

Get-ServerEvents.ps1 -list E:\Prod\ad_servers.txt -outputpath E:\ServerStatus\Prod\AD\errorevents.html

$adtimer.stop()

$time = $adtimer.Elapsed

Send-MailMessage -SmtpServer smtp.mymailserver.com -From ServerStatus@mydomain.com -To me@my.com -Subject "AD Status Elapsed Time" -Body "All prodcution Active Directory servers processed in $time (Hours, Minutes, Seconds) HTML pages updated."

Once you’ve finsihed creating the scanning task scripts, we’ll need to schedule them as repeating tasks using the Windows task scheduler. Be sure the account that you choose to excute these scripts with has enough permssions to scan the servers and that WinRM is enabled on the systems you are collecting data from.

Scheduled_Task_Folder
Add a folder for all the tasks
Task_trigger
This task runs every 15 minutes, note the Daily and Repeat options.
task_action
Powershell.exe goes in the program or script box. Enter the full path to your script between “” in the arguments.

When you save the task you’ll be prompted for the credentials to run it with. Running the scripts does consume resources from the server(s). Tune your schedule to be frequent enough to be useful, but not too taxing on the servers. Every 15 minutes works well in my environment.

Assuming you’ve followed all the articles in this series and that your scheduled tasks have executed at least once you should now be able to access the pages for each group of systems. In your browser you’ll go to: http://nameofserver/virtualdirectory/errorevents.html
http://nameofserver/virtualdirectory/stoppedservices.html
http://nameofserver/virtualdirectory/winservstatus.html
The system is functional but not very convienient. It would be better to see each group on their own page; all AD status, or all Exchange status for example. There are several ways you could accomplish this.

If you have SharePoint, build a site for ServerStatus. Add a page for each group of servers (AD, Exchange, etc.) and on each page insert three content viewer web parts. Each content viewer web part will reference the output html page of one of the status scripts. Take your time and be sure to title the web parts appropriately. If you’re careful, you can end up with something that looks like a professional monitoring tool. SharePoint’s menu system will build the drop down menus that you see in the title image automatically.

Iframed_Pages

If you don’t have SharePoint you can get a simliar effect by using iframes. You’ll need to create a master html page for each group. AD.HTML for example, then use an iframe to embed the output of each of the three scripts onto the page. The HTML to create an iframe is:


With a lot of work and time you can build a tool that keeps watch over your servers while you work on other things. There’s no limit to how far you can take a tool like this. Alerts for thresholds, reports, and more are just a few lines of code away.

PowerShell System Monitoring Part 3. Server Status Report

If you’ve been following this series then you know that we’re on a mission to create a poor man’s monitoring system from just PowerShell scripts and a web hosting engine. So far we’ve created HTML pages that show the warnings and errors from a group of server’s event logs. We’ve also made a report that displays all of the server services set to automatic but not running.

The scripts that we’ve written so far, use parameters to specify their file output paths and input of a list of servers to scan. Later in the series, these options will help us create logical groups of systems that make our monitoring system easy to use. For example; all Exchange servers, or all Active Directory servers will be grouped together on separate pages. One of the scripts that we will write, will create the lists of servers that belong in each group. Those groups in-turn will be used to feed the scripts that are collecting our data and creating the HTML reports. It sounds confusing and it is, that’s why I’m writing about it one part at a time. It will all come together in the end, though.

Connectivity, CPU load, memory and storage consumption, are the basic metrics required for any monitoring system worth its salt. I could sit here and bang out the code needed to get the data we’re after from WMI \ CMI and output it to HTML easily enough. One of the great things about PowerShell though, is that its ubiquitous and you don’t always have to invent the wheel yourself. In this case, somebody else has already cranked out 99% of the code we need, so we’ll just modify his.

Mike Galvin, Dan Price, and Bhavik Solanki have written a wonderful PowerShell script called Windows Server Status Monitor. It uses WMI to pull CPU, memory, storage, and online status information from a list of servers and can display the results as a color coded HTML file. It also contains an alerting feature, emailed results, and can run once or continuously. You can download the script from Mike’s Blog, GitHub, or the PowerShell Gallery.

My personal project required trending data. I need to see these performance metrics over time. Mike’s script can output a CSV file instead of HTML, but it deletes the files it creates each time it is run. With just a little tweak to the CSV output file we can ensure each file is unique and therefor not deleted. If you need trending as well, make ths change. Under the comment ## Setting the location of the report output; find $OutputFile and set the variable to something like:

$Outputfile = $OutputPath\WinServ-Status-Report"+"_" + (get-date -Format M-dd-yyyy-h-m)+".csv

This change will create a CSV file that includes the date, hour, and minute in the filename. You could also include seconds or even milliseconds if you’re going to run this in a continous loop. Please be aware that you’ll need to monitor the folders you are outputing these files to. If you’re running WinServ-Status in a 5 minute loop against 20 groups of systems you’ll be making 1200 CSV files per hour. The files are small but they’ll add up over-time.

When we put all of this together a few posts down the line, you’ll see that we run WinServ-Status.PS1 twice; once to create the HTML file and again to make a CSV.  As with the other scripts in this series you’ll want to save them to C:\Program Files\WindowsPowerShell\Scripts\ to make them easier to run as a scheduled task or to call from any PowerShell session. If the “Scripts” folder isn’t in that path, just make it yourself. If you install the WinServ-Status script from the PowerShell gallery or from GitHub it will end up in that folder by default.

In the next article for this series we’ll build our lists of servers to run the data collection scripts against. After that, will be how to get IIS setup to host the HTML reports we are creating, followed by getting the scheduled tasks that run everything setup, and finally how to diplay all of this data in a sensible manner.

PowerShell; System Monitoring Part 2. Stopped Automatic Services Report

In the first article in this series I explained the goal. I want to help you create a server monitoring dashboard with nothing more than a few PowerShell scripts and a web server. Before we build the web site, we need to create the scripts that gather the information and create the HTML reports.

In an article a while back, I showed how to use PowerShell to list stopped automatic services and suggested that you might want to output the data to HTML. That is exactly what we’re going to do here.

</p>
param (
[string] $list,
[string] $outputpath
)

$style = "&lt;style<span>&lt;/style&gt;BODY{font-family: Arial; font-size: 10pt;}"
$style = $style + "TABLE{border: 1px solid black; border-collapse: collapse;}"
$style = $style + "TH{border: 1px solid black; background: #dddddd; padding: 5px; }"
$style = $style + "TD{border: 1px solid black; padding: 5px; }"
$style = $style + ""</span>

Function Problems {
$servers = Get-Content $list

Foreach ($server in $servers)
{Get-Service -ComputerName $server |where {($_.StartType -eq "Automatic") -and ($_.Status -match "Stopped|.*Starting|.*Paused") -and
($_.Name -notmatch "CDPSvc.*|.*gupdate|.*RemoteRegistry|.*MapsBroker|.*sppsvc|.*WbioSrvc|.*iphlpsvc|.*tiledatamodelsvc|.*clr_optimization_v4.0.30319_64|
.*clr_optimization_v4.0.30319_32")}|
select @{n="Server";e={$server}}, @{n="Stopped Service";e={$_.displayname }}
}
}

$report = Problems|Sort-Object Server|ConvertTo-Html -Head $style|Out-String

#Send-MailMessage -SmtpServer my.emailserver.com -From alerts@mydomain.com -To me@mydomain.com -Subject "Stopped Server Services" -Priority High -BodyAsHtml:$true -Body $report}

$report|out-file -FilePath $outputpath

The script above is written to use two parameters when called, -list should be the path to a text file containing the severs you want to scan. The -outputpath parameter is the location to save the HTML report.

You’ll notice the $_.name -notmatch section contains several service names. These services are set to automatic but do not keep running if they don’t have work to do. The regex pattern keeps these services from showing up in the report as false positives. You may need to add a few more for your environment, especially .Net versions.

There’s also an option to email a copy of the report. Just un-remark the line and populate the sever name and addresses. The HTML report will be embedded in the email, not attached.

In the next post for this series, we’ll generate a system status report to go along with the events and services, then we’ll put them all together in a dashboard.

PowerShell; System Monitoring Part 1. Get-ServerEvents, a windows event log error report.

After you have more than a handful of servers on your network, it can be challenging to catch small issues before they take something down and get noticed by users. What you need is a good monitoring tool; one that captures resource consumption, error events, installed software, shows patching status, and that generally helps you keep an eye on your systems.

If your place is like a lot of the businesses I’ve worked for, you probably have a bunch of emailed reports from various systems that amount to SPAM. You try to watch the emails and texts but they vomit so much useless data all over your inbox that its hard to make sence of it. Important notifications end up lost in the noise.

Purchasing a multi-thousand dollar monitoring tool is not always possible. The more nodes you have, the more expensive a monitoring tool will be. Math says that you won’t need a monitoring tool until you have a lot of stuff to watch, which almost guarantees that a commercial solution it isn’t going to be cheap. Spending money on something that doesn’t directly generate profitable returns can be a challenge for any company but outages hurt customer and worker confidence in your systems. This situation can leave technologists feeling trapped.

As system admins, engineers, or architects, we know that the operating system has and reports most, if not all, of the information that we require. We can connect the MMC Computer Management snap-in or the Server Administrator tool to almost any computer and see its event logs, service status, and more. The problem is, that the data isn’t correlated and filtered in a way that provides us with the up/down, big picture, view that we need to proactively correct small problems before they become big ones.

Computermanagement

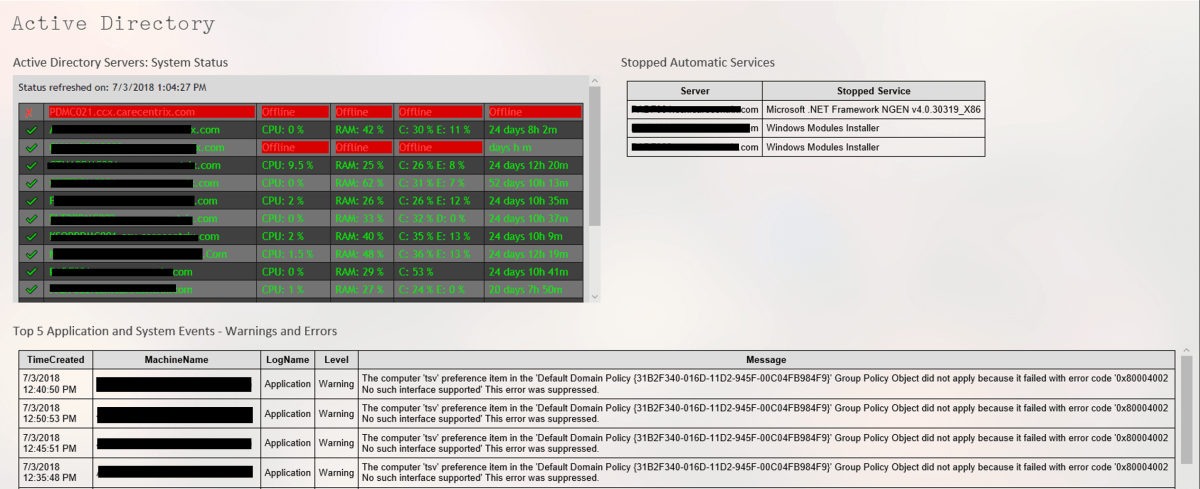
In this series we’ll examine how PowerShell can help gather all of the data we need from every windows system attached to our network. We’ll use it to generate HTML reports that, in the end, will be uploaded to a web hosting engine so that we can see our system’s status at a glance. The solution isn’t going to compete with System Center or Solarwinds but its better than 10,000 unread items in your inbox and it is entirely free (assuming that you have Windows CALS).

I have to break this down into component parts, or the post would be a book. Stick with me and I think that you’ll end up with a functioning monitoring tool. Feel free to take all the credit for yourself. Maybe your boss will give you a raise. Just read my blog once in a while without your ad-blocker turned on and we’ll be even.

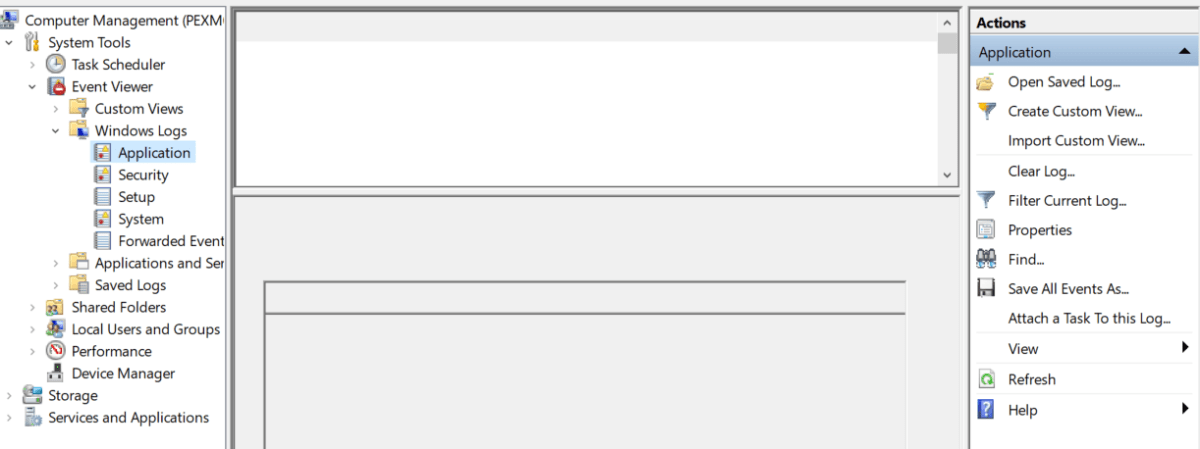
First up is the Windows event logs. Microsoft, in all of their geniousnous; has been spitting out the classic Application, Security, Setup, and System event logs for as long as I can remember. The amount of data they collect is impressive. Typically, they are my first stop on any trouble shooting endeavor. We all know the drill; open the Computer Management MMC, right-click on the system name to connect to a remote PC, and then filter for errors and warnings. You can configure them to dump to a database for correlation / indexing but most of us never get that far. We end up logging on to a problem system and manually checking the logs for relevant messages one at time. Stop doing that, you’ll go blind!

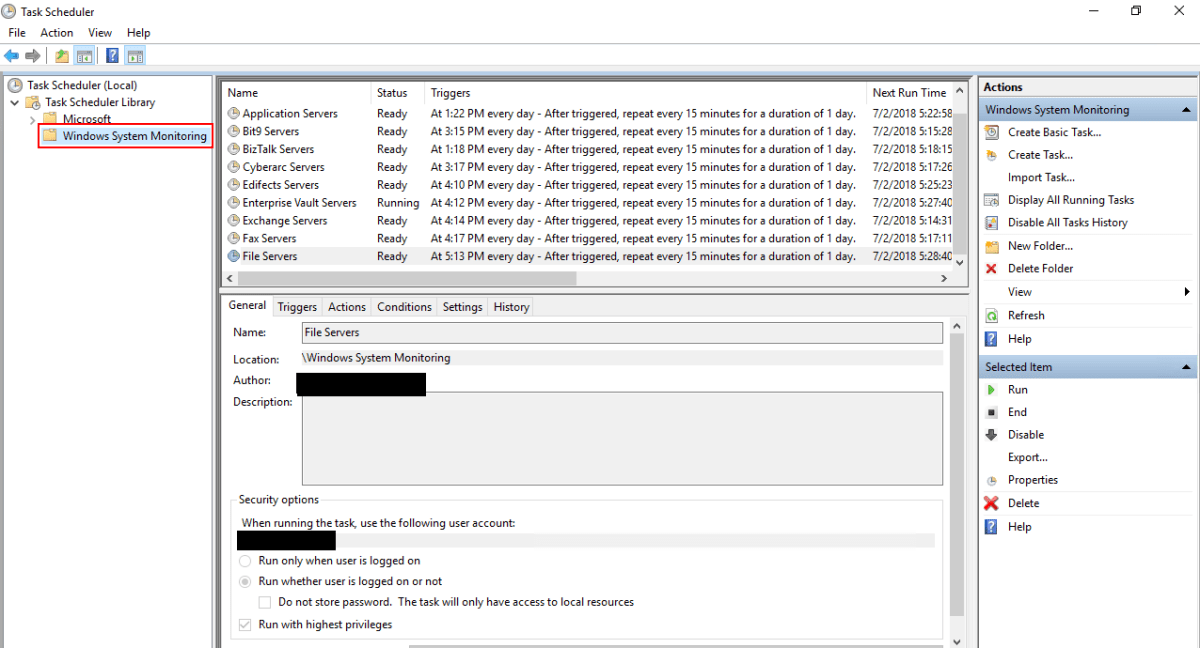
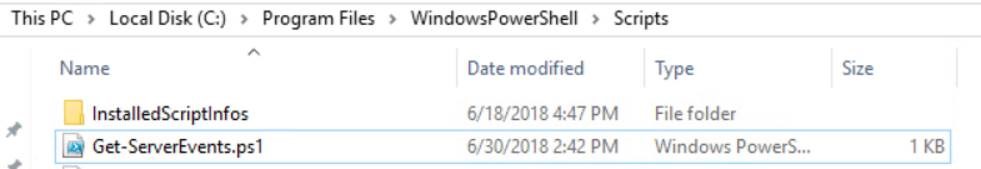
PowerShell will get us the same information, a nice filtered for errors, view of the logs but it can do it in bulk.. The code below is written to be a module that you can call from a scheduled task or from another script. If you’re going to follow the whole series to build my tool you will want to run it as a module. Copy the code and save it as a Get-ServerEvents.ps1 file in the C:\Program Files\WindowsPowerShell\Scripts folder. If the scripts folder isn’t there; make it.

Poweshell Modules

param (
[string] $list,
[string] $outputpath
)
$style = "
BODY{font-family: Arial; font-size: 10pt;}"
$style = $style + "TABLE{border: 1px solid black; border-collapse: collapse;}"
$style = $style + "TH{border: 1px solid black; background: #dddddd; padding: 5px; }"
$style = $style + "TD{border: 1px solid black; padding: 5px; }"
$style = $style + ""

Function Get-Events {
$servers = Get-Content $list
Foreach ($server in $servers) {
Get-WinEvent -ComputerName $server -MaxEvents 5 -FilterHashtable @{Logname ="Application"; Level=2,3;StartTime=(get-date).AddHours(-1)},
@{Logname ="System"; Level=2,3;StartTime=(get-date).AddHours(-1)} -ErrorAction SilentlyContinue|Select TimeCreated, MachineName, Logname,@{n="Level";e={$_.LevelDisplayName}},Message
}
}
$report = Get-Events|Sort-Object Machinename, Logname |ConvertTo-Html -head $style|Out-String
$report|out-file -FilePath $outputpath

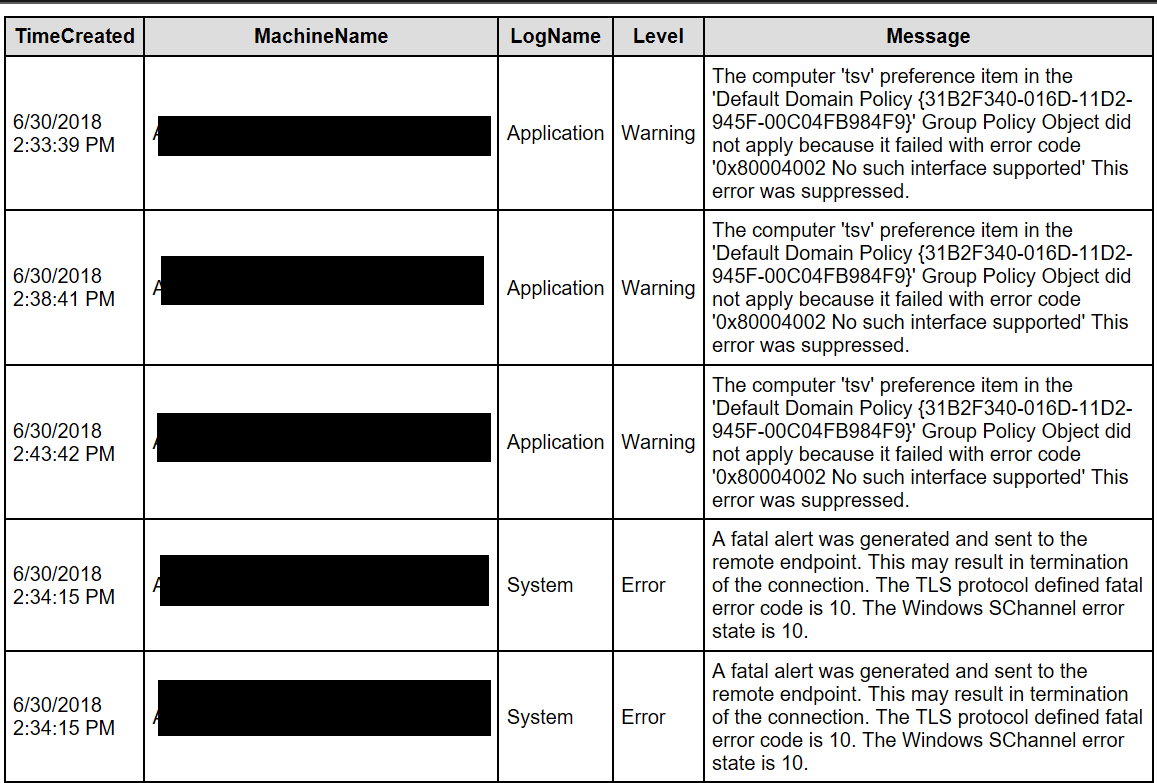
The script will gather the last 5 application and system event log errors and warnings that occurred in the last hour for a list of servers and output them into a basic HTML table.

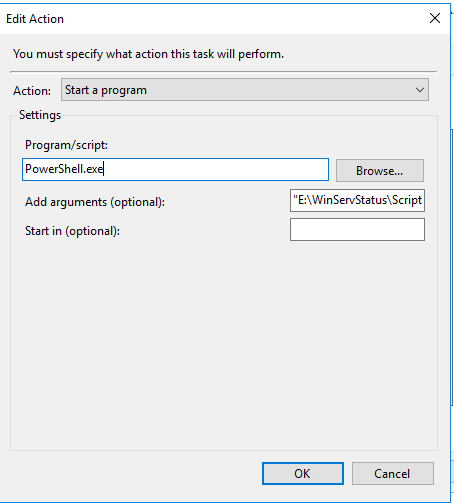
To run the script, create a *.txt or *.csv file containing the hostnames of the systems you want to see events for and then call or run it with the -list and -outputpath parameters. For example; Get-ServerEvents.ps1 -list c:\users\myname\my documents\ad_serverts.txt -outputpath \\reports_server\myreports\ad_serverts.html

If you don’t want to mess with text files you could also use the OU structure in AD as the source of your computer names. Mine organizational units didn’t line up with the way I needed my reports to look hence the text file parameter. If you don’t have that problem try changing the $server variable.

$servers = Get-ADComputer -Filter * -Searchbase “OU=MyOU, DC=mydomain, DC=com | Select dnshostname -ExpandProperty dnshostname
[/Code]

When you run the report you’ll end up with a nice, neat, HTML file like the one below. It’s easy to attach to an email notification; just add a Send-Mailmessage command to the bottom of the script. If you follow the rest of this series we’ll end up publishing the report(s) to a website.

Event report

PowerShell: Find Windows File Shares

Quite a few businesses have server networks that were grown over time with servers being added to meet some demand or another – a’ la carte – rather than a designed network in which an architect planned the distribution of every platform and it’s associated servers. The organic distribution of systems often results in nobody knowing what’s out there in total. Sure, the admins know what’s on the systems that they take care of but who has the big picture?

Recently, I was asked how many windows file shares were on a network that I help support. As it turns out, the answer was that nobody knew. None of our existing tools had a mechanism that would help us investigate quickly and easily. I’m glad I paid attention in PowerShell class.

The code below will connect to a domain controller and locate all of the Windows Server computers. Then, it will scan each one for file shares using WMI (excluding admin and IPC shares) and report the results in a csv.

Import-Module ActiveDirectory

$servers = Get-ADComputer -Properties * -Filter {(OperatingSystem -like "*Windows Server*")}|Select DNSHostName -ExpandProperty DNSHostName

$filter = "Type = 0 And Description != 'Default Share' And " +
"Name != 'ADMIN$' And Name != 'IPC$'"

$servers |
ForEach-Object { Get-WmiObject -Computer $_ -Class Win32_Share -Filter $filter } |Select-Object @{n='Computer';e={$_.__SERVER}}, Name, Path, Description |
Export-Csv -Path $env:userprofile\documents\server_shares.csv -NoTypeInformation